The Dataset

Inspection-verified property data at national scale — structured, standardized, and ready for analysis

Explore what's inside the Collateral Dataworks dataset: property attributes, photo documentation, market context, and delivery options.

Dataset Overview

One of the largest inspection-verified property datasets available

Every record is tied to a Universal Property Indicator — linking inspection records, images, attributes, and comparable sales at the property level.

4.3M
Unique property records across 2.8M properties — majority within the last 3 years
200M+
Property images extracted, mapped, and tied to inspection context and date
~300
Structured data attributes per property across subject and comparable sales
5M+
Total property records targeted by 2026 with monthly and weekly update cadence
3–6
Comparable sales per record — expanding geographic reach and market context
50 States
National geographic coverage — all major US markets represented in the dataset

What's In the Data

Hundreds of attributes across four core categories

Each record maps attributes across the subject property and its comparable sales — all tied to a Universal Property Indicator for cross-record analysis.

Property Condition

Time-stamped, verified condition at the moment of field inspection

Condition and quality ratings captured by licensed professionals using standardized forms — covering interior and exterior features not available in public records or MLS data.

Overall condition rating (C1–C6)
Overall quality rating (Q1–Q6)
Effective age vs. actual age
Deferred maintenance notes
Roof condition and material
Foundation type
Heating / cooling systems
Kitchen and bath condition
Flooring type and condition
Basement / garage details
Pool, outbuildings, site features
Updates and improvements

Full data dictionary available under MNDA. ~300 total attributes across subject and comparable records.

Market & Valuation

Professional-derived market and valuation context

Structured valuation data derived directly from standardized inspection report forms — including assessed value, market condition assessments, and market trend indicators tied to the inspection date.

Appraised value
Market value opinion
Market condition rating
Neighborhood trend (improving / stable / declining)
Exposure time estimate
1004MC market data fields
Absorption rate
List-to-sale price ratio
Days on market (DOM)
Prior sale price and date
Cost approach value
Income approach value

Market data fields sourced directly from standardized professional inspection report forms.

Photo Documentation

200M+ images linked directly to field inspection observations

Interior and exterior photos tied to each property record, inspection date, and field context. Images are mapped to the Universal Property Indicator for cross-record visual history.

Exterior front / rear / street
Interior — kitchen, baths, living areas
Roof and foundation details
Outbuildings and site features
Image date and inspection record linkage
UPI cross-reference for history

Computer vision condition/quality extraction in development. Available via separate image delivery.

Neighborhood Dynamics

Professional observations about the surrounding market

Neighborhood-level data captured during each field inspection — including land use, built-up percentage, price range, and proximity assessments that contextualize the subject property.

Urban / suburban / rural classification
Built-up percentage
Growth rate (rapid / stable / slow)
Neighborhood price range
Predominant age of housing stock
Adverse proximity factors
Single-family vs. multi-family mix
Commercial land use share

Neighborhood fields are professionally observed, not modeled or estimated.

Comparable Sales

Professionally selected comparable sales with full adjustment grids

Each record includes 3–6 comparable sales selected by a licensed professional, with address, sale price, adjustment values, and physical characteristics — enabling true comp-based analysis at scale.

Comp address and proximity
Sale price and sale date
Above-grade GLA
Bed / bath count
Condition and quality ratings
Age and effective age
Adjustment grid — all line items
Net / gross adjustment amounts
Adjusted sale price
Financing type
Concessions
Professional comp selection notes

Linked to subject property via UPI. Enables comp-pool analysis across 2.8M property records.

Visual Evidence

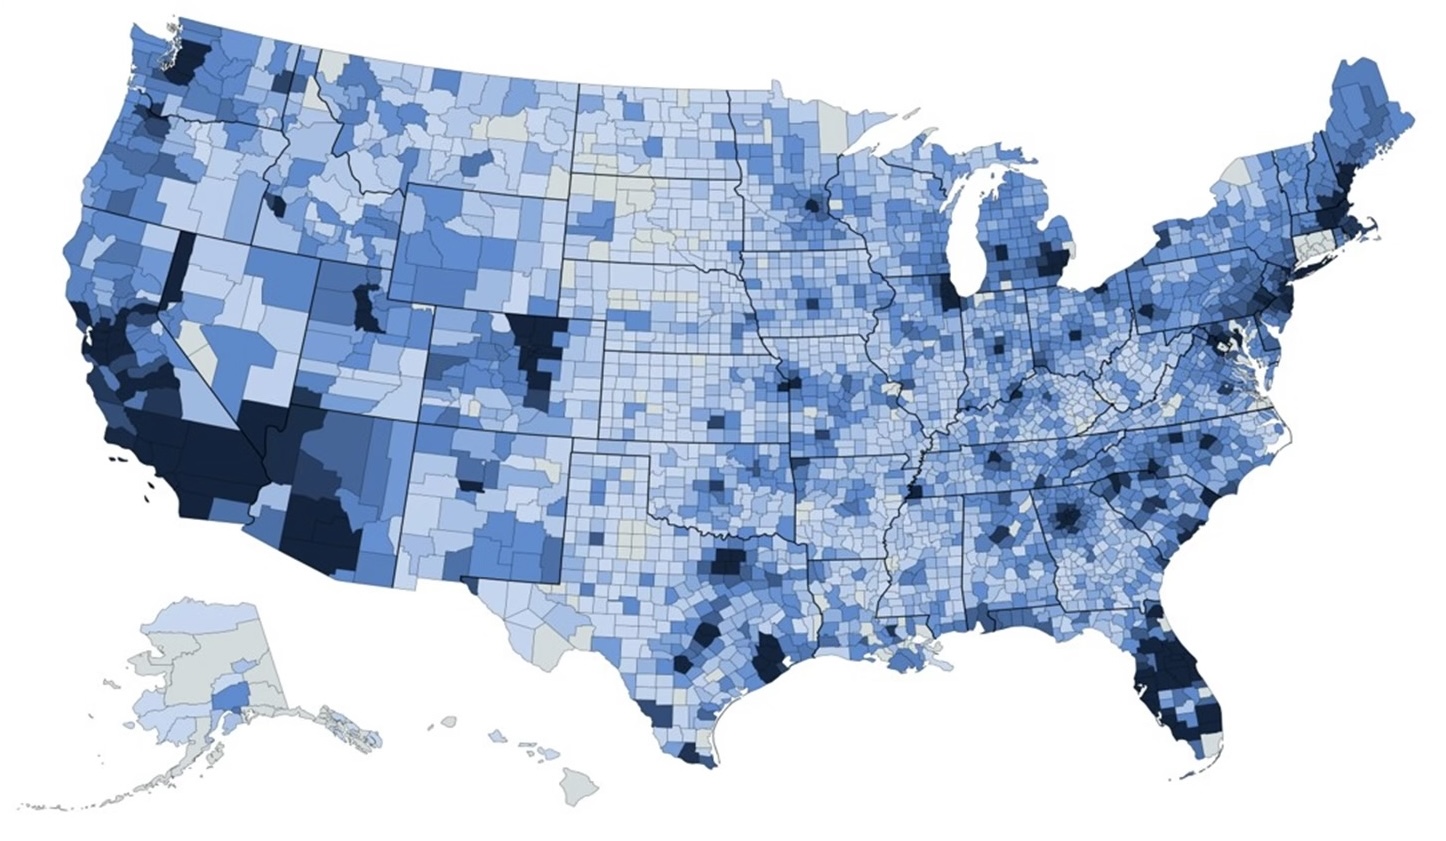
200M+ images — linked directly to field inspection observations

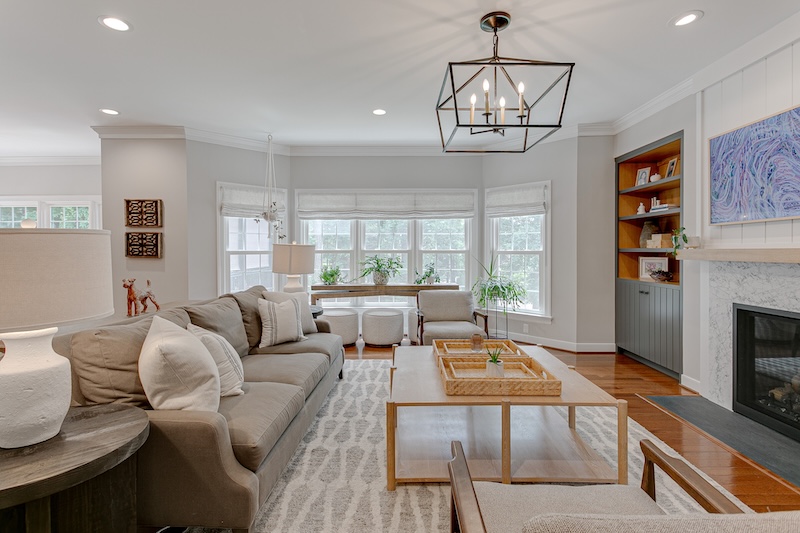
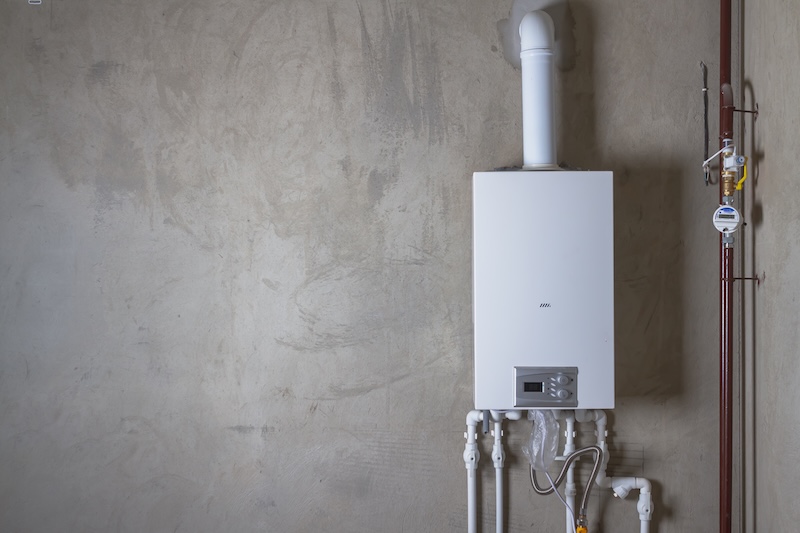
Every record includes interior and exterior photos tied to the property record, inspection date, and field context. Images are mapped to the Universal Property Indicator for cross-record visual history.

  • Exterior Roofs, siding, lots, driveways, curb appeal
  • Interior Kitchens, baths, bedrooms, living areas, flooring
  • Metadata Tied to inspection context, date, and property features
  • Analytics Computer vision tools for condition and quality extraction in development

Image analytics in development — computer vision assessment for automated condition and quality metadata extraction

Farmhouse style living room Gas boiler in new house Kitchen sink Street view in Rochester
US Coverage Map

Expanded Data Footprint

Broad market intelligence through comparable sales data

Each record includes 3–6 comparable sales, expanding the dataset beyond individual properties to deliver neighborhood-level trends, historical pricing, and market-level condition context.

This expands both the geographic reach and the temporal depth of the dataset — capturing market conditions at the time of each transaction, not just at point-in-time snapshots.

3–6
Comparable sales per record
National
Coverage across all US markets
Monthly
Data update frequency
3 yrs
Majority of data within last 3 years

Data Delivery

Structured for the platforms and pipelines you already use

Collateral Dataworks data is delivered in a clean, integration-ready format — all attributes tied at the property level for easy ingestion.

File Format

Data is available in JSON and tabular (CSV) formats, with all attributes tied at the property level via the Universal Property Indicator.

JSON Tabular (CSV) Property-level linking UPI cross-reference

Update Cadence

Monthly and weekly updates available as new inspection records are added — keeping your models and platforms current with fresh market intelligence.

Weekly updates Monthly updates Incremental delivery

Data Dictionary

A full data dictionary documenting all ~300 attributes is available to qualified parties under a Mutual Non-Disclosure Agreement (MNDA).

~300 attributes Available under MNDA Subject + comp mapping

How to Access the Data

Four steps from inquiry to integration

1

Request Access

Submit an access request via the contact form to initiate the conversation with our data team.

2

Sign MNDA

Execute a Mutual Non-Disclosure Agreement to receive the full data dictionary and sample dataset.

3

Evaluate & License

Review the dataset, discuss licensing terms, geographic scope, and delivery format with our team.

4

Integrate

Receive your first data delivery in JSON or tabular format and begin integrating with your platform or models.

Ready to explore the dataset?

Request access or reach out to discuss licensing, coverage, and integration options with our data team.

Request Access Request Data Dictionary